-1667287426.jpg)
Traders utilize the numerous patterns available in technical analysis to make educated guesses about where prices may be heading.
Contracting patterns are common, and they occur when the market has some volatility before settling down and contracting, creating a shape on the chart resembling a wedge or a triangle.
Technical analysts typically employ patterns like the rising wedge pattern.
As the name implies, a rising wedge is a bearish pattern that indicates the market is likely to continue moving lower or turn bearish, depending on the prevailing trend.
However, under the appropriate circumstances, the rising wedge can be seen as a bullish pattern by certain traders.
When a market consolidates between two converging support and resistance lines on a chart, a recognizable price movement known as the rising wedge pattern is created.
Both the support and resistance lines must point upwards in order for a rising wedge to develop, and support must also be steeper than resistance.
Wedge patterns frequently result in breakouts, just as head and shoulders, triangles, and flags. This breakout is often bearish in the context of rising wedges.
In either a rising or declining market, ascending wedges can form:
A market trending upward indicates that investors are reevaluating the bull run.
When a market is sliding, it is only a temporary respite until the bear market resumes.
A rising wedge appears bullish at first glance. After all, each peak and trough after it is higher than the last.
But the most important thing to realize is that upward movements are becoming less frequent. This indicates that a bearish opinion is developing (or reforming, in the case of a continuation).
This negative mood intensifies to the point that anyone holding a long position may hurry to sell their position in order to minimize losses when the market crosses its rising support line.
Meanwhile, those who are holding off on shorting the market will enter. This results in a selling wave that gives the market strong downward momentum.
Any market that is well-liked by technical traders, such as indices, FX, and stocks, might experience rising wedges.
To create a wedge trading strategy, you must select when to open, take profit, and trim losses.
You should validate the breakout before opening your position because not all wedges break out.
The breakout can validate the move. Here, you're aiming for a strong move over the support trendline for a rising wedge or resistance for a falling one.
For rising wedges, traders wait for a break above a support point. The general rule is that support becomes resistance in a breakout, thus the market may bounce off past support levels on its way down.
Thus, you may wait for a breakout, then wait for it to return and bounce off the ascending wedge support region. You can verify the move before opening your position.
Falling volume during market consolidation is another clue of a wedge near breakout. Volume spikes after a breakout indicate a greater advance.
Two trading breakout rules apply again here. First, support will become resistance and vice versa.
ABC stock's falling wedge peaks are $65, $55, and $45. These resistance points may assist its future rise.
Second, a prior channel's range might signal a later move's magnitude. It's usually the wedge's initial high-low gap. After a rising wedge breakthrough, the market may plummet 100 points.
Wedge trading, like any breakout, should show when a move is invalidated. Example: a rising wedge.
EUR/USD falls below its wedge support line but rebounds and makes a new high. Both lines have been surpassed, breaking the pattern.
Place a stop loss at the previous market high to close the transaction before additional losses.
You might also set a stop loss above support. If the prior support fails to become resistance, you close your trade.
When it comes to enhancing the performance of the wedge patterns you identify, the number of ways available to you is practically limitless.
However, in this section, we would like to discuss three tactics that we have discovered to be effective in some of our trading strategies.
 Keep Pushing Your Profitable Trading With AssetsFX Keep Pushing Your Profitable Trading With AssetsFX |
Just keep in mind that this is in no way a guarantee that they will perform effectively for your market. Again, we advocate using backtesting to ensure that the strategies you employ function as intended.
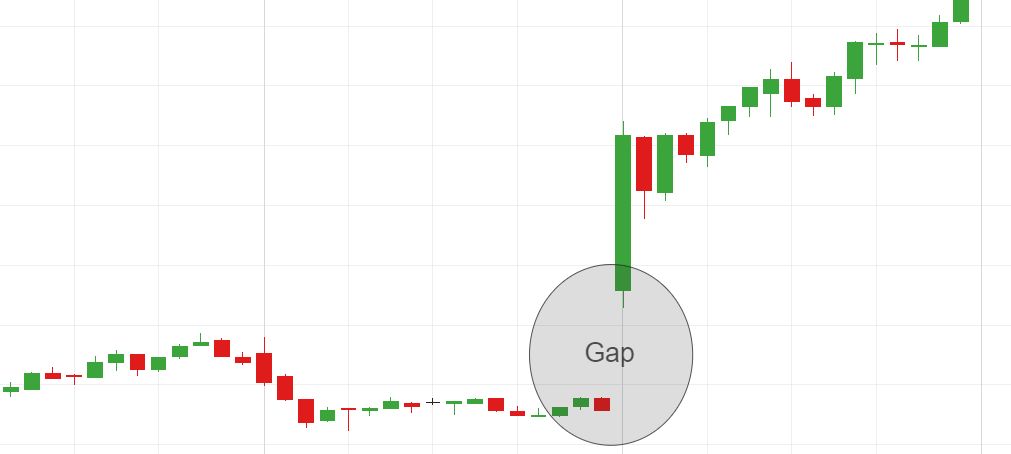
1. Gaps
Gaps can indicate whether a market is bullish or bearish. For instance, if there are several negative gaps, we may suggest that bears are currently in charge and that a downward breakthrough is more likely.
Additionally, evaluate the magnitude of the gaps. As a general rule, the greater the disparity, the greater its significance.
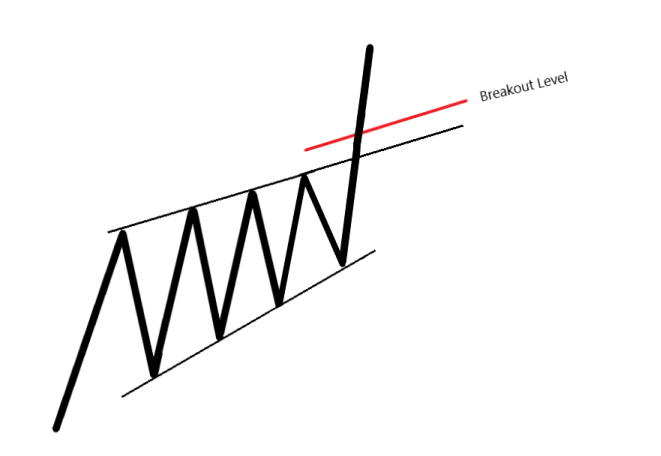
2. Adding distance to the breakout level
Adding a distance to the breakout level itself is one method employed by some traders to fight fake breakouts.
This reduces the likelihood that the breakout level will be passed by random price movements.
The graphic below depicts a situation in which the breakout level is just over the support line.
3. Volume patterns
As you may recall, the rising wedge's initial description included a form of volume pattern. Nonetheless, this does not prevent us from introducing new rules that might have a substantial effect on performance!
In breakout trading, a frequent volume requirement is to require that the breakout occur with sufficient volume.
Thus, we might infer that several market participants participated in the movement, which, in principle, should render it more relevant.
Price pattern techniques for trading systems seldom beat buy-and-hold strategies, but certain patterns can predict broad price trends.
Some studies imply that a wedge pattern will breakout towards a reversal (a bullish breakout for falling wedges and a bearish breakout for rising wedges) more than two-thirds of the time, with falling wedges being more dependable than rising wedges.
Because wedge formations converge to a tighter price channel, the gap between the trade entry price and the stop loss price is lower than at the start of the pattern.
This implies that a stop loss may be put near to the trade's start, and if it succeeds, the return can be larger than the initial risk.
Wishing you all profitable trading.
How To Trade With The Rising Wedge Pattern?
Fundamental Aspects Of Rising Wedge! -NewsSails
On October 14, How Should I Trade EUR/USD? Simple Pointers For Newcomers | Newssails