Curiously, the EUR/USD currency pair continued to trade in the same flat on Thursday.
Compared to the preceding days, volatility rose, although the pair traded essentially sideways.
Remember that the most crucial data of the week, the US inflation report, was released on Thursday.
In September, the consumer price index slowed to 8.2% year-over-year.
The dollar surged by 110 points on the release of this news, which, from our perspective, is quite rational, given that the 0.1% decline in inflation was minimal.
Today, the chance of a 0.75 percentage point rate hike by the Federal Reserve at its upcoming meeting has increased to over 100 percent.
This is excellent news for the US dollar, as the more monetary policy is tightened, the higher the dollar may go.
Given that the euro/dollar is close to its 20-year lows, we continue to expect the decline to continue.
In addition, the local lows of this week were broken and updated today, and the geopolitical and fundamental conditions remain unfavorable to the euro.
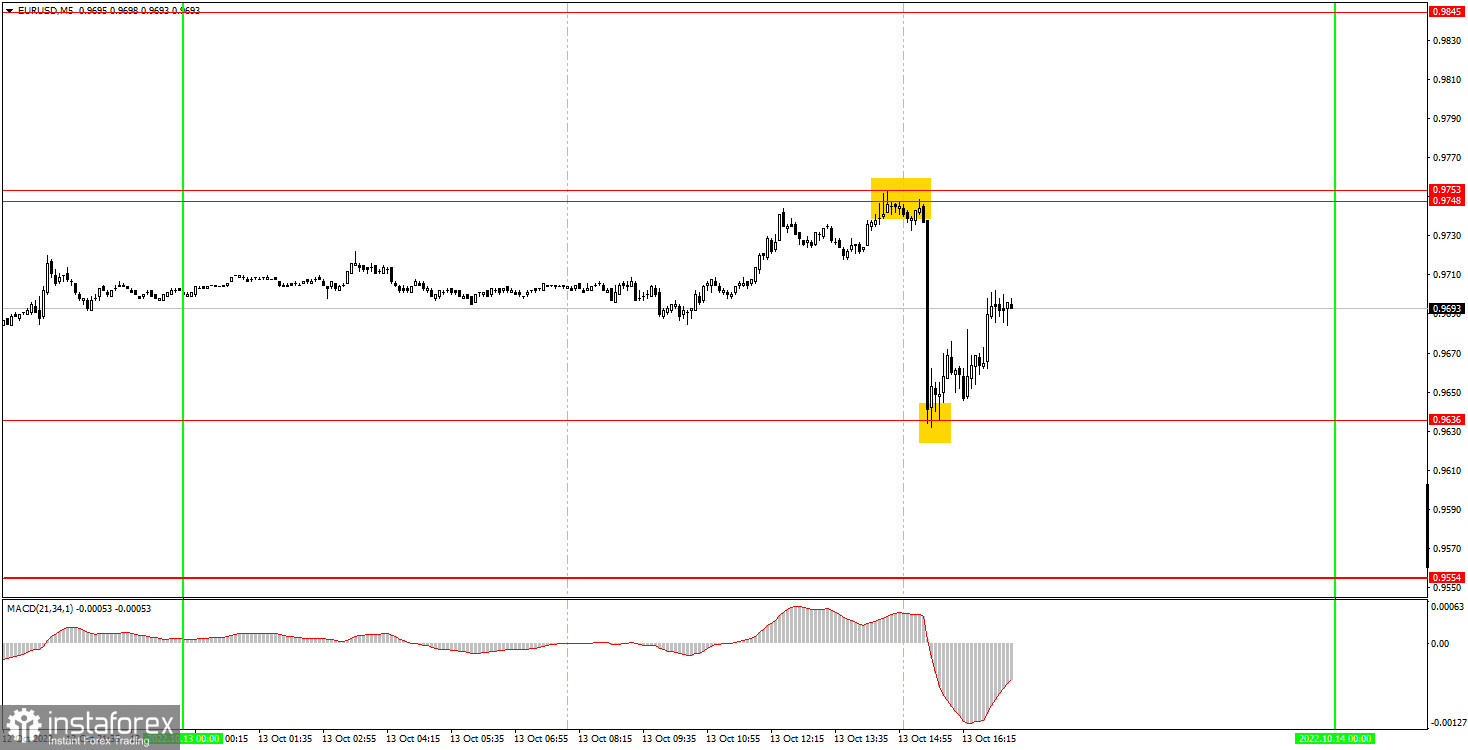
Thursday's five-minute window saw an almost flawless execution of the maneuver.
The pair rose somewhat in the morning before colliding with the 0.9748 level and falling down to the 0.9636 level.
Obviously, the US inflation report, and not a technical indicator, precipitated this drop, which occurred in five minutes.
However, new traders may have time to interpret this signal, as it originated half an hour before the actual publication of the data.
Obviously, it was required to close the trade and level Stop Loss over 0.9753. It was difficult to foresee in advance which direction the movement would take place.
Consequently, new traders may opt to avoid taking risks. The second purchase signal in the shape of a rebound from the 0.9636 level was likewise highly precise and could be calculated.
As a consequence, we earned around 84 points on the first transaction and 30 points on the second. The long position had to be manually closed late in the afternoon.
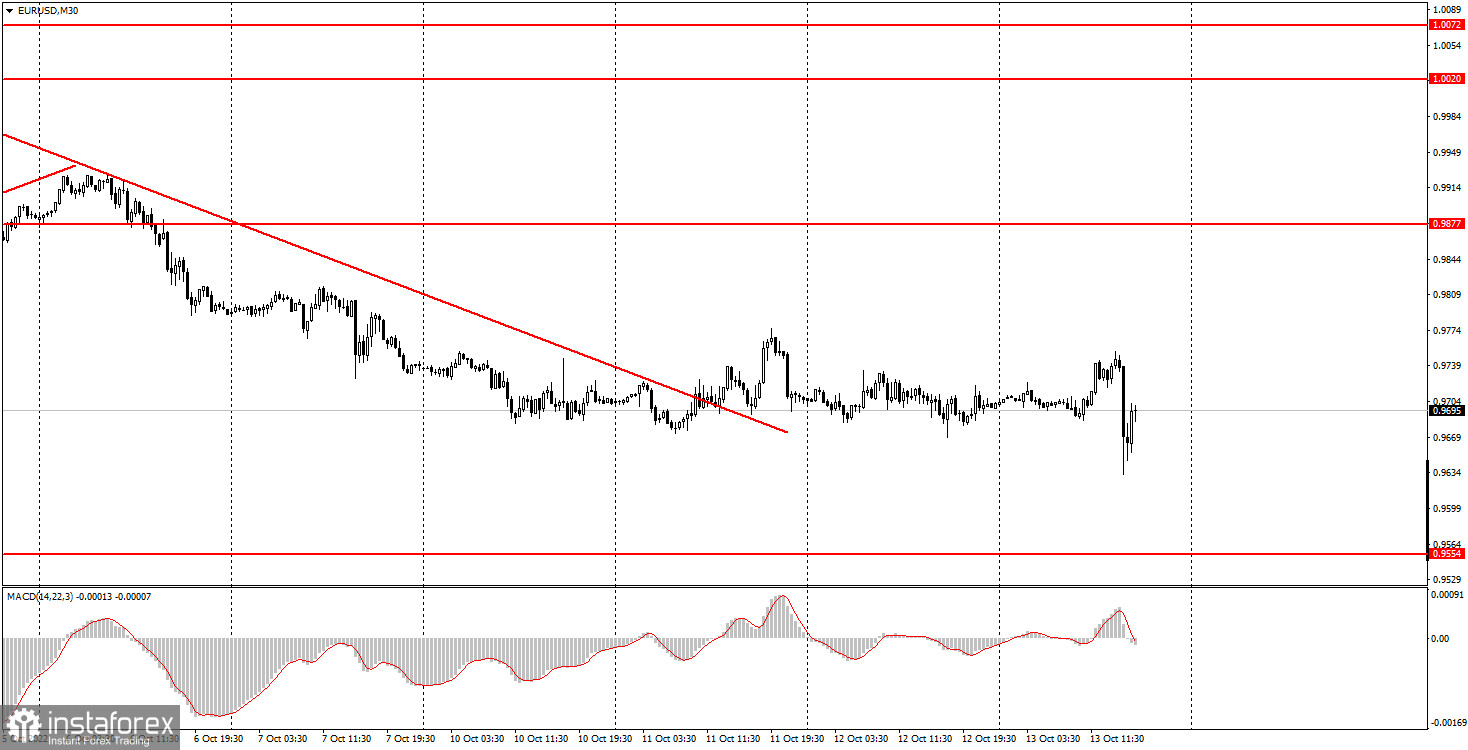
Despite settling above the falling trend line, the pair retains a downward trend on the 30-minute period; nonetheless, it has been trading in a complete flat for the last four days.
Trading is currently inconvenient. In the near future, we anticipate that the pair may continue to decline and retest its 20-year lows.
The euro once again demonstrates its unreadiness for substantial growth. On Friday, the recommended trading range for the 5-minute TF is 0.9554, 0.9636, 0.9748-0.9753, 0.9845, 0.9877, and 0.9952.
When crossing 15 points in the correct direction, stop loss should be set at breakeven. There are no significant events scheduled for the EU on Friday, but the University of Michigan will release a study on retail sales and consumer mood index in the United States. We anticipate that there will be no response to this statistics, or that it will be minimal.
 Keep Pushing Your Profitable Trading With AssetsFX Keep Pushing Your Profitable Trading With AssetsFX |
1) The signal intensity is calculated based on the amount of time it took for the signal to develop (bounce or overcome the level). Less time was required, the stronger the signal.
2) If two or more trades were opened around a certain level based on faulty signals (which did not trigger Take Profit or the nearest target level), all further signals from this level should be disregarded.
3) In a flat, each pair may generate several misleading signals or none at all. In any event, it is best to cease trading at the first hint of a flat.
4) Trade agreements are opened between the start of the European session and the middle of the American one, when they must all be terminated manually.
5) Using signals from the MACD indicator, you may only trade on the 30-minute time frame if there is high volatility and a trend verified by a trend line or trend channel.
6) If two levels are too close together (between 5 and 15 points), they should be deemed a support or resistance zone.
Support and Resistance Levels are the levels that act as buying and selling goals on the chart. Place Take Profit close to these levels.
Red lines are the channels or trend lines that depict the current trend and indicate the optimal trading direction.
The MACD (14,22,3) indicator consists of a histogram and a signal line. This is a signal to join the market when they cross. Using this indicator in conjunction with trend lines is advised (channels and trend lines).
Important speeches and reports (which are always included in the news calendar) can have a significant impact on the movement of a currency pair.
In order to prevent a sudden price reversal in the opposite direction of the preceding trend, it is suggested that traders quit the market with the utmost caution or completely.
Forex beginners should realize that not every trade must be lucrative. The key to long-term success in trading is the formulation of a distinct trading strategy and prudent money management.
What Is It A Wedge, Rising & Falling Wedge?
FP Markets Won The Award For "Best Global Value Broker"
Elon Musk Demonstrates Off The Humanoid Robot "Optimus" At Tesla's AI Day