A rising wedge is a type of technical indicator that suggests a reversal pattern, and bear markets are good places to look for such patterns.
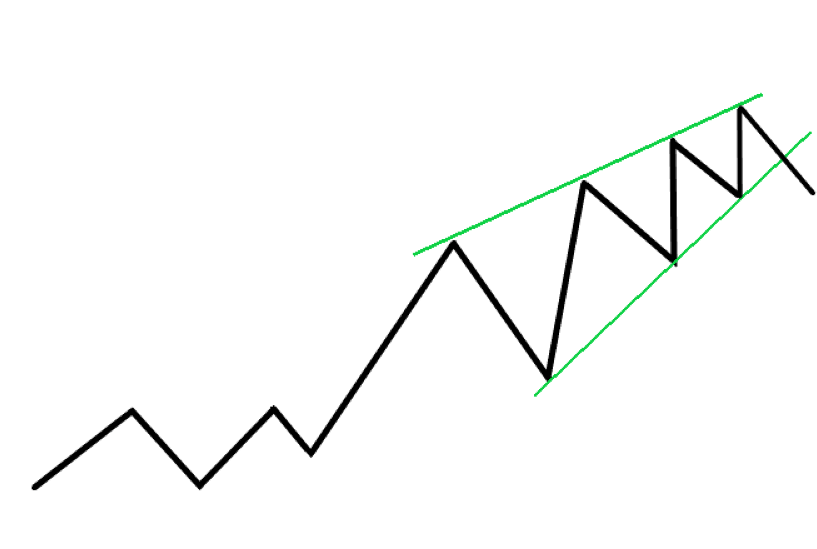
This pattern is recognizable on charts as an ascending trend with pivot highs and lows that converge toward a single point known as the apex as the price rises higher.
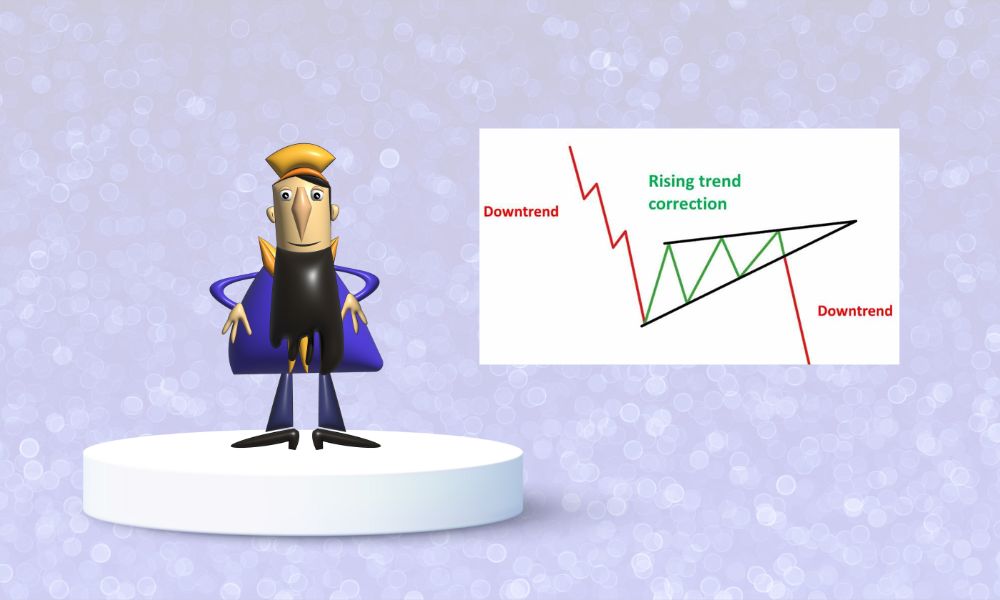
It is possible that this will herald a reversal in the trend as well as a continuation of the bear market if it is accompanied by a decline in volume.
As was said, the rising wedge is a bearish pattern that, depending on the direction of the trend that came before it, typically indicates either the termination of the ongoing bullish trend or the continuation of the bearish price swings.
As far as the definition of the pattern is concerned, it is rather similar to a wedge that has both of its lines ascending, as can be seen in the image that is located above.
The definition of the pattern, as well as the numerous circumstances, need to be taken into account.
The main parts of a rising wedge are the support and resistance lines, volume, breakout, and the preceding trend.
You should be able to draw a resistance line connecting the highs and a support line connecting the bottoms as the wedge builds.
As one may assume, both of these lines should be trending upwards and converging, such that the market's distance travelled decreases as it advances deeper into the wedge.
According to the pattern's original concept, you want to see both lines converge with the same slope. However, if the resistance line (the upper line) isn't rising as quickly as the support line, it indicates that the bullish forces aren't quite strong enough to propel the market to greater highs, which some see as a bearish indicator.
According to the original specification, the volume should decrease as the pattern progresses towards the wedge.
This merely indicates that as the market rises, fewer and fewer market players are prepared to get in. As a result, it's logical to expect markets to come around sooner rather than later.
The breakout happens at the end of the rising wedge pattern. As you may have guessed, we expect the breakout to be in the negative direction, indicating that the market is taking off and heading down.
 Keep Pushing Your Profitable Trading With AssetsFX Keep Pushing Your Profitable Trading With AssetsFX |
Most breakout traders consider a breakout to the downside to being a signal that a new bearish phase has begun or will continue, depending on the previous trend.
However, one of the most difficult components of breakout trading, in general, is not acting on fake breakouts when the market just swings around shortly after breaking out!
Another thing to keep in mind is that the pattern must be preceded by a bullish trend in order to qualify as a reversal pattern.
In general, a long-running trend will be more difficult to stop than one that hasn't been building for as long.
This is because market players become accustomed to the trend's direction, making them more inclined to purchase on dips. As a result, it is more difficult for the market to completely reverse.
That is not to imply that long-term trends will not reverse. It's only that the market has gained momentum in favour of the present trend.
Furthermore, as is often the case in the stock market, there are certain signs that indicate that the present trend will continue.
Rising wedges have a risk-to-reward ratio that is generally low, and as a result, skilled technical traders enjoy utilising them in their trading strategies.
Investors should be careful of the various patterns that appear to be rising wedges but are actually disguised fraudulent patterns or patterns in disguise.
The only way to tell a fake rising wedge from a real one is to look for price and volume divergences and check that the failure point is still below the 50% Fibonacci retrace.
This is the only method to distinguish between a real and a fake rising wedge.
On October 14, How Should I Trade EUR/USD? Simple Pointers For Newcomers | Newssails
Elon Musk Demonstrates Off The Humanoid Robot "Optimus" At Tesla's AI Day | Newssails
FP Markets Won The Award For "Best Global Value Broker" At The 2022 GLOBAL FOREX AWARDS | Newssails