Tushar Chande and Stanley Kroll are credited with the development of the indicator known as the stochastic relative strength index (RSI).
The acronym StochRSI is what most people are familiar with when referring to this indicator.

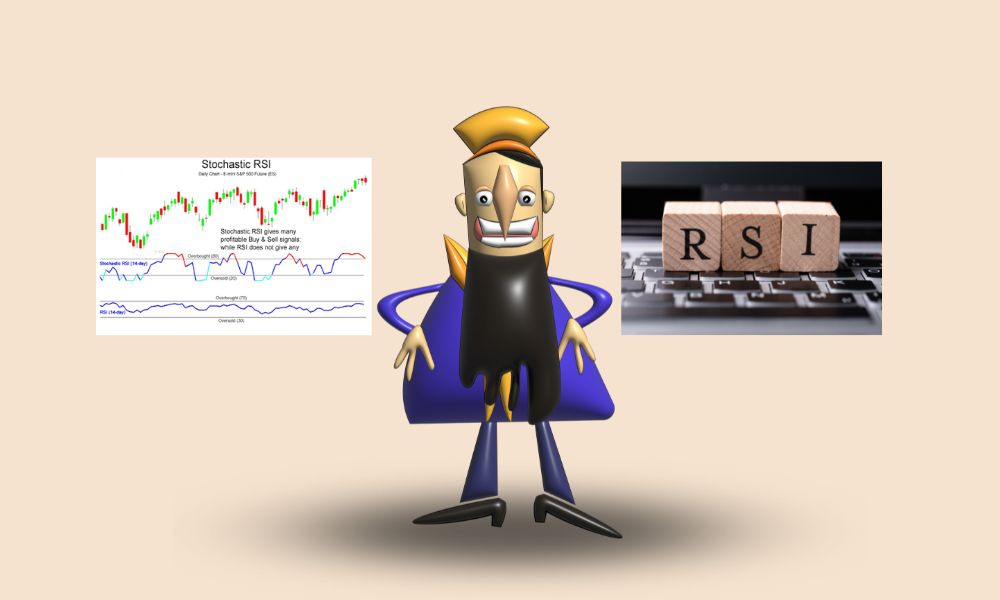
The Stochastic Oscillator (SO) and the Relative Strength Index are the two parts that make up this well-known indicator (RSI).
When developing a trading strategy, one of the most common ways to use the stochastic relative strength index (StochRSI) is to look for readings that fall between the overbought and oversold ranges.
This is one of the most common ways to use the stochastic relative strength index. Readings that are lower than 0.2 are considered to be in an oversold state, whereas readings that are higher than 0.8 are in an overbought state.
The StochRSI is calculated using a scale that ranges from 0 to 1, with 0 denoting the center point of the scale.
When conditions are overbought during a larger uptrend, these conditions are interpreted as bearish signals, and when conditions are oversold during a larger downtrend, these conditions are interpreted as bullish signals.
However, due to the extremely high degree of volatility exhibited by the stochastic relative strength index, extreme caution is required.
After receiving a signal that the market is overbought or oversold, traders should wait until the subsequent price action confirms the move before making any trade entries.
For instance, readings that indicate that a particular asset has been overbought should not be interpreted as an entry signal but rather as a caution regarding a potential move.
This is because such readings serve as a warning about the possibility of a move.
The stochastic relative strength index (RSI) indicator needs to move back below the 0.5 centerline in order to provide evidence that the bearish trend is still active.
In the wake of oversold readings, the stochastic relative strength index (RSI) is unable to rise above 0.5 in the absence of a larger bullish trend.
A potential shift in the prevailing trend may be on the horizon if the oversold or overbought zones of the stochastic RSI are maintained for an extended period of time.
Let's say that a specific security has been trending sharply downward for a number of weeks, and that the RSI readings for the security have ranged anywhere from 18 to 60.
The Relative Strength Index (RSI) currently shows a reading of 56 for the current session.
This RSI reading, which is typically not considered an actionable indicator, paints a different picture according to the StochRSI calculation than the conventional interpretation does.
 Keep Pushing Your Profitable Trading With AssetsFX Keep Pushing Your Profitable Trading With AssetsFX |
The value of the StochRSI for this session is equal to 0.9, which is calculated as (56 - 18) / (60 - 18).
The significant overbought signal that developed within the larger downward trend indicates that the price is likely to continue falling after the bullish correction comes to an end.
This is because the larger downward trend is still in the ascending phase.
As soon as the StochRSI drops below 0.5, you should initiate a short position by placing orders at the market or at the limit, depending on which method you prefer.
Set a stop-loss order at the level that corresponds to the highest high that the bullish retrace reached.
The bulls attempted to push the price higher than this level in the past, but they were unable to do so successfully.
If the price is able to move higher than this level, the current downward trend may finally come to an end.
Given that the stochastic relative strength index (StochRSI) produces a large number of signals, which can be either positive or negative, it is prudent to look for additional indicators that support the continuation of a trend.
Signals from the stochastic relative strength index (StochRSI) are amplified whenever there is persistently high volume and candlestick patterns, such as the falling three methods.
Indicators that are related to oscillators include the stochastic oscillator as well as the relative strength index.
When plotted on a price chart, prices frequently behave in a predictable manner in many different instances.
Therefore, is there any justification for utilizing both at the same time? The answer to that question is yes.
However, this must be done in a thoughtful manner. The EMA200 serves as both an oscillator and a trend filter in our current strategy, which also makes use of other indicators.
Oscillators are utilized in a manner that deviates significantly from the norm, as you are about to see.


